Immigration is an issue that I care about a lot. If you read this blog, take a few minutes to watch this well done presentation. This is serious stuff!

Immigration is an issue that I care about a lot. If you read this blog, take a few minutes to watch this well done presentation. This is serious stuff!
Here is how Microsoft’s business breaks down. This data is all from Microsoft’s Annual Report, June 30, 2006.
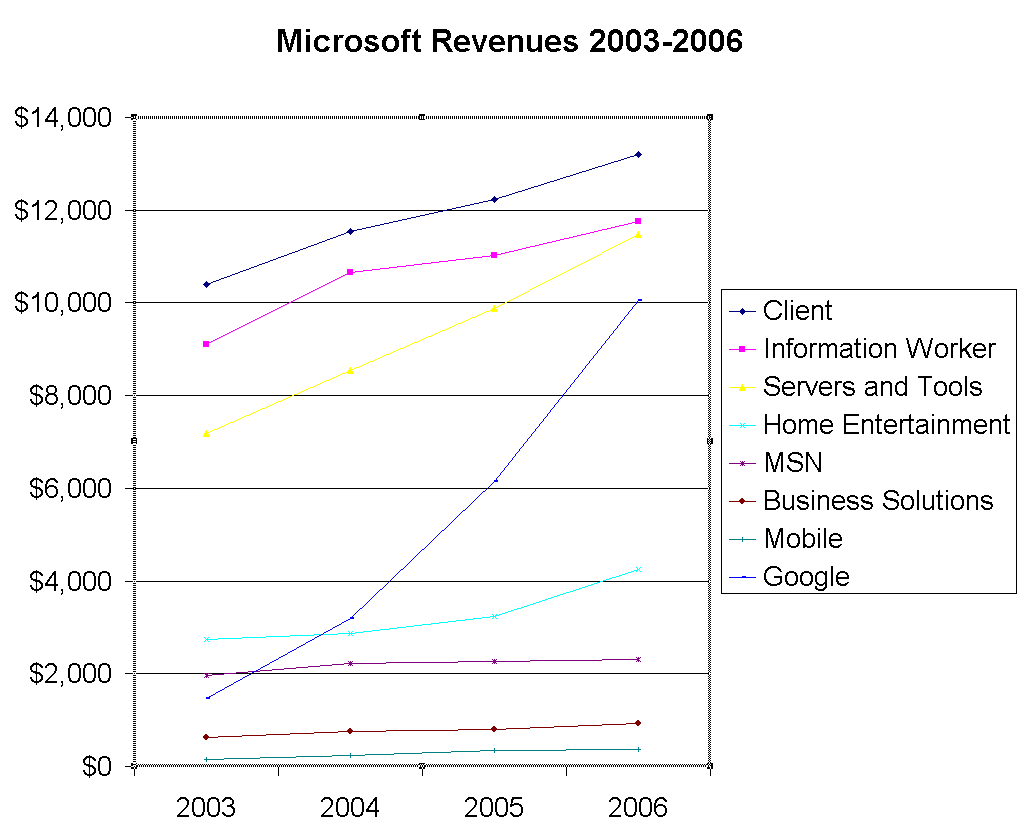
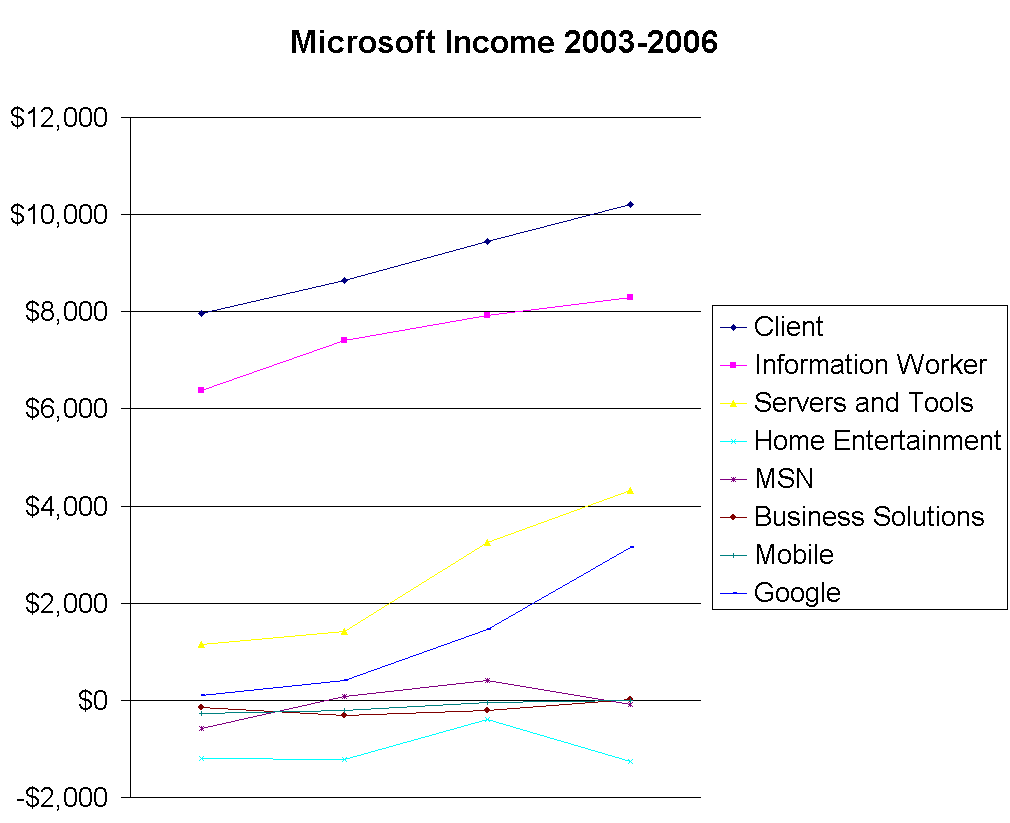
From 2003-2006, Microsoft has reported revenues in 7 business units. Prior to that they reported 4 business units, but I’m not going that far back. I’ve also included data from Google’s annual reports 2003-2006 just to put things into perspective.
Click the charts for full details.
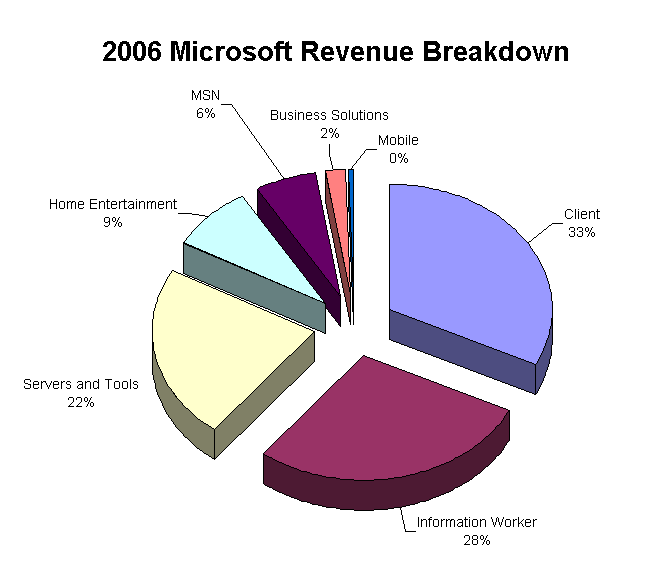 Microsoft’s businesses are:
Notice that 3 of Microsoft’s business units are each significantly larger than Google as a whole, both in terms of revenue and income. (I estimated Google’s 2006 numbers, since they are not reported yet).
 All of us that work on server products have weathered storms where our services had to endure a wave of traffic. The wave could be caused by any number of things – time of day, a particular press release, or a new product launch. Generally, you plan these events very carefully to make sure that engineers and operations staff are on hand when the Wave hits.
Now, imagine you work at Apple. You know your wave is coming. When? Christmas Day, of course. Yikes! Hard to change that. Some are reporting Apple’s traffic spike at a 1000% increase over the prior week – causing the site to go down. Imagine you are the poor Director of Server Engineering there, and responsible for keeping the site up? So much for Santa Claus – you have to go to work!
I know, it’s hard to feel sorry for the successful. But for some reason, I feel for them on this one. Of course, you might feel more sorry for the millions of people that tried to use the iTunes site on Christmas Day.